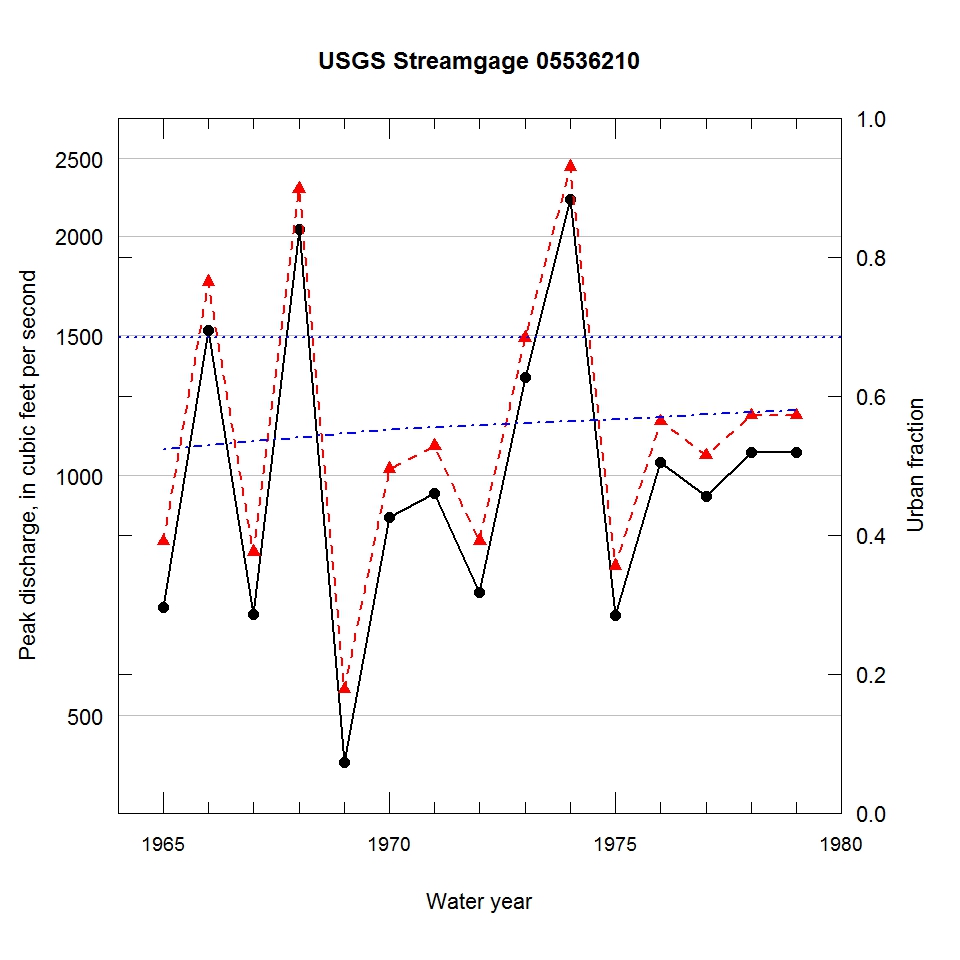
Observed and urbanization-adjusted annual maximum peak discharge and associated urban fraction and precipitation values at USGS streamgage:
05536210 THORN CREEK NEAR CHICAGO HEIGHTS, IL


| Water year | Segment | Discharge code | Cumulative reservoir storage (acre-feet) | Urban fraction | Precipitation (inches) | Observed peak discharge (ft3/s) | Adjusted peak discharge (ft3/s) | Exceedance probability |
| 1965 | 1 | -- | 376 | 0.523 | 1.439 | 684 | 827 | 0.621 |
| 1966 | 1 | -- | 376 | 0.528 | 3.139 | 1520 | 1750 | 0.086 |
| 1967 | 1 | -- | 376 | 0.534 | 1.482 | 670 | 802 | 0.647 |
| 1968 | 1 | -- | 376 | 0.540 | 3.775 | 2040 | 2290 | 0.034 |
| 1969 | 1 | -- | 376 | 0.546 | 1.195 | 437 | 539 | 0.883 |
| 1970 | 1 | -- | 376 | 0.552 | 1.540 | 886 | 1020 | 0.432 |
| 1971 | 1 | -- | 376 | 0.555 | 1.393 | 950 | 1090 | 0.374 |
| 1972 | 1 | -- | 376 | 0.558 | 2.427 | 714 | 828 | 0.620 |
| 1973 | 1 | -- | 376 | 0.561 | 1.269 | 1330 | 1490 | 0.153 |
| 1974 | 1 | -- | 376 | 0.564 | 3.206 | 2220 | 2440 | 0.027 |
| 1975 | 1 | -- | 376 | 0.567 | 1.688 | 667 | 770 | 0.681 |
| 1976 | 1 | D | 376 | 0.570 | 1.692 | 1040 | 1170 | 0.306 |
| 1977 | 1 | -- | 376 | 0.573 | 1.708 | 942 | 1060 | 0.399 |
| 1978 | 1 | -- | 376 | 0.576 | 1.393 | 1070 | 1190 | 0.288 |
| 1979 | 1 | -- | 376 | 0.579 | 0.356 | 1070 | 1190 | 0.290 |

